Webinar: How to Search for Social Media Attention
In July, 2022, we attended a webinar from Altmetric on “How to Search for Social Media Attention”. We previously published an article on the MDPI Blog, which answers some frequently asked questions about altmetrics and how they can be used to monitor how far our research is shared online.
Patty Smith, Altmetric’s Senior Engagement Manager, hosted the webinar, and gave a helpful hands-on demonstration of how to use the explorer tool to search for social media attention in different ways. This is a massive, if not the largest, source of research sharing currently.
The host started off by providing a succinct definition of altimetrics as “indicators of non-traditional attention and engagement with digitally published research and scholarship”.
Complementary to traditional citation-based metrics, altmetrics show the discussions that people are having online surrounding a specific subject area. Therefore, all the data can be used together to gain a more comprehensive overview of the attention a specific research output is attracting.
What sources does Altmetric track and how can we see them?
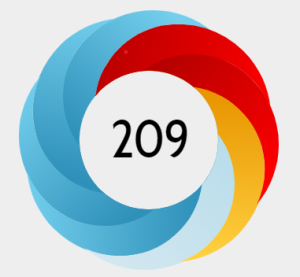
We then went on to see the sources that Altmetric tracks. It was explained how each source falls into a category, such as policy documents, peer reviews, Wikipedia, Facebook and Twitter. Each of these categories is represented by a colour. The Altmetric badge then gives us visual information about where the research we are looking at is being discussed. Accordingly, the more colourful the badge, the more places it has been mentioned.
What is the Altmetric Score?
You might be wondering what the score in the middle of the Altmetric badge represents. This is an indicator of the volume of attention that a research output has obtained. As you can imagine, then, a high score indicates that many people have engaged with it. However, it is not necessarily an indicator of quality or positivity.
However, this is not a raw count, but a weighted score. Altmetric uses a well-thought-out weighting system based on how much attention a source is likely to generate. For example, a mass media news article will generally generate much more attention than a single tweet. Logically, it carries more weight in the score. This score is an initial basis, but it is better to delve deeper into where the output is actually being discussed and what is being said about it to get a better idea of the kind of attention the research is receiving.
Sharing Research Online
For research to be tracked across different sources, Altmetric needs a research output with a persistent identifier: a DOI, ISBN, PubMed ID, handle ID, etc. When sharing research, it is important to include a link to the original research output. This is so that the program can track the persistent identifier. Make sure to link back to the original research and not to secondary citations when talking about it online.
Different Ways to See Social Media Attention
The webinar showed then us how to look at the social media attention of a particular research output by using the search functions in Altmetric Explorer.
Highlights Tab
We can do this by clicking on the Edit Search button, entering the research output we are looking for, e.g., a specific journal, and the dates we are interested in. By clicking on the blue bar labelled “social media” in the Highlights tab, we can see a breakdown of where these mentions are coming from. We can then click on each one, which will redirect us to the Mentions tab, where we will be able to see all posts in reverse chronological order.

Research Outputs Tab
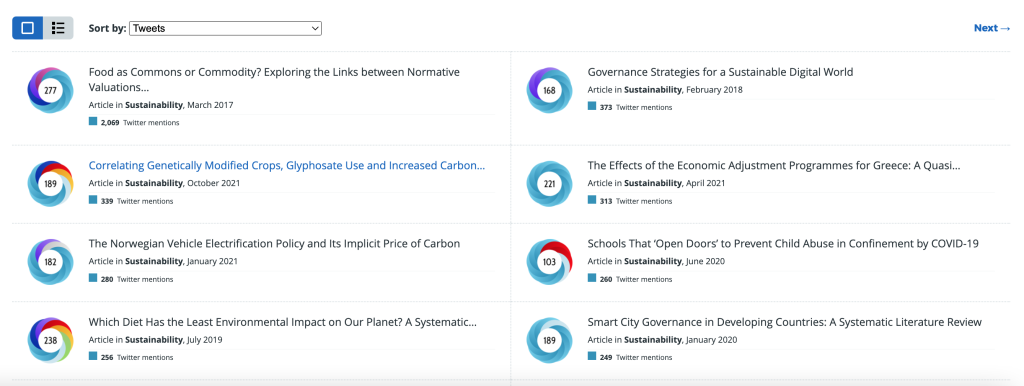
In the Research Outputs tab, we can sort by different criteria, for example, tweets. Sources with the most Twitter mentions will go to the top of the page. We can then click on the source we’re interested in, and then click either Twitter or Facebook. This will then take us to all the individual Twitter and Facebook mentions. We can then download these results as a CSV file.
Timeline Tab
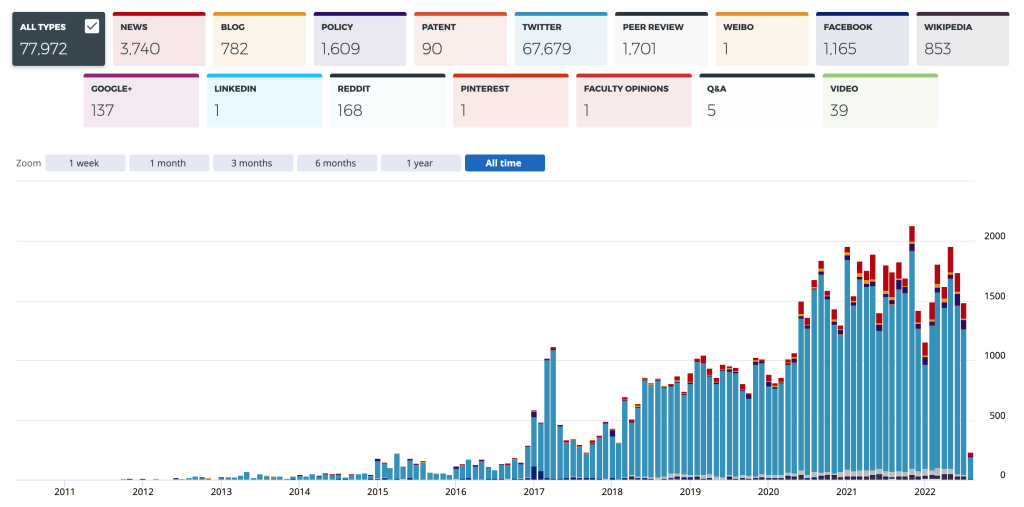
The Timeline tab allows us to adjust the timeline to obtain an overall view of mentions or clicks on a specific source. This shows us the results for that particular research output. Additionally, we can click on a specific category and period of time, which will redirect us to the Mentions tab. Here, all the individual mentions in detail for these criteria are shown.
Demographics Tab
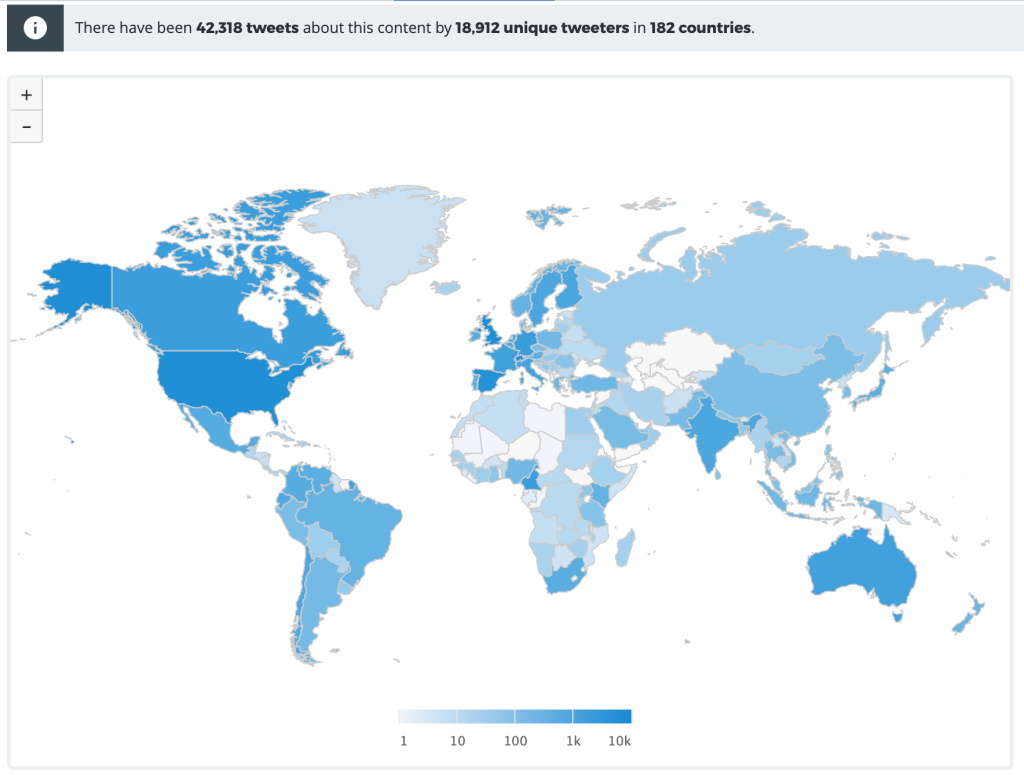
The Demographics tab shows heatmaps of worldwide social media attention. We can see these for Twitter and Facebook mentions. For example, if we refine the search to Twitter, it tells us the total number of tweets from the total number of different tweeters, in the total number of different countries. We can then click on each country. This again takes us to the Mentions tab where we can see all the individual mentions. This then allows us to limit searches by source types, right down to specific Twitter accounts.
Identifying Influencers
The webinar then turned its focus onto how we can identify the main influencers generating social media attention. These are people who are promoting the research we are interested in online.
The Mention Sources tab is the easiest way to find who these different influencers are. In this tab, we can easily limit our search to a specific source type. For example, for Twitter, you can see the top account that has mentioned a particular research output the most, along with how many times they’ve mentioned the research and their total number of followers.
Using the advanced search, we can input a list of research outputs we’re interested in, e.g., a list of related journals, into the ‘journal or collection’ search box. When we then go to the Mentions tab, we will be provided with a broader overview of the main influencers promoting this kind of research.
Social media influencing is a relatively new, yet highly effective marketing strategy. Therefore, identifying social media attention and influencers to engage with is incredibly important for any organisation.

