Figure Editing: Interview With Author Services’ Production Coordinator Larry Liu
Clear and high-quality figures are highly valuable for communicating research findings. Such visuals play a crucial role in enhancing readers’ understanding of scientific papers by making complex data more accessible and engaging.
MDPI Author Services’ figure editing team ensures that authors’ visuals meet professional standards, optimizing them for clarity and consistency.
In this article, we interview Larry Liu, the Production Coordinator of MDPI Author Services, and explore the significance of figure editing, common pitfalls, and best practices for creating impactful research figures.
What is your role at MDPI and what drew you to the position?
I’m the production coordinator at MDPI Author Services, where I oversee the production of layout and figure editing tasks.
The main reason why I was drawn to this position is that Open Access (OA) is revolutionizing the future of research and MDPI is at the forefront as one of the largest OA publishers and a true pioneer in the field.
Being part of such an excellent company allows me to contribute meaningfully to this transformative movement in academic publishing.
What does the figure editing service entail?
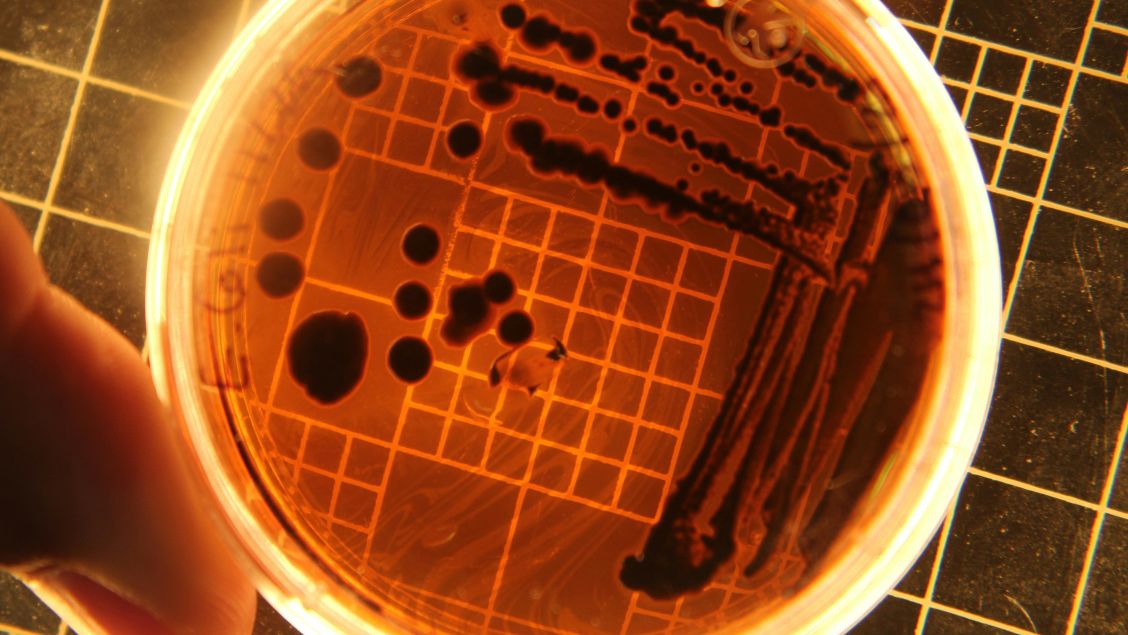
The figure editing service produces publication-ready figures that clearly communicate research to readers. We enhance charts and graphs by revising the colors, shading, size, resolution, borders, font, and file type.
How do high-quality figures affect the success of academic papers?
The saying “a picture is worth a thousand words” couldn’t be truer when it comes to academic writing. In recent years, more and more studies have highlighted the crucial role that figures play in research articles.
Good figures simplify complex data and make key findings more accessible to readers. Well-designed visuals not only capture attention but also enhance visibility, drawing the interest of both researchers and a wider audience.
Clear and professional figures demonstrate a researcher’s commitment to quality, potentially leading to more citations and a greater impact within the academic community.
How does this benefit academics and their research?
The design team who conduct figure editing consists of editors who have years of experience in academic publishing, coupled with expertise in visual design and scientific research data visualization.
Our mission is to optimize figures, enhancing their readability and visual appeal, which in turn saves valuable time for scholars. This allows them to focus more on their scientific research, confident that their data are presented effectively.
What are some common mistakes you come across in academic figures?
Common mistakes can be roughly divided into three categories:
Poor Clarity and Readability
-
- Small fonts or unreadable text: Labels, axis values, or annotations that are too small to read (especially after resizing).
- Low-resolution images: Blurry graphs and photos, especially when compressed using software (e.g., Microsoft Word).
- Overcrowded visuals: Lots of data or overlapping labels without a clear layout.
- Poor contrast: Text or symbols blending into the background (e.g., black text on a dark color).
Color and Design Issues
-
- 3D effects: Using 3D bar charts or pie charts that distort proportions.
- Redundant decorative elements: Adding clipart, gradients, or icons that don’t enhance understanding.
- Inconsistent styling: Varying font sizes, line weights, or symbol styles across figures in the same paper.
Inconsistency with Journal Requirements
-
- Writing errors: “x” vs. “×”, “0,01” vs. “0.01”, “1 liter” vs. “1 L”, etc.
- Technical errors: Incorrect dimensions, or resolution (typically 300+ DPI is acceptable for images).
How do you maintain quality and consistency across figure editing submissions?
To ensure that figures meet academic publishing standards, we have established strict and comprehensive figure editing guidelines.
We regularly train editors and hold workshops to ensure the professionalism of editors. Additionally, we utilize professional image processing software, such as Adobe Illustrator and Photoshop, to create vector graphics, ensuring the clarity and high resolution of figures.
We value the importance of teamwork and quality control processes. Each figure undergoes a thorough check before delivery, and a dedicated person reviews the design style consistency of all images in the article.
What advice would you give to authors when creating visuals for their work?
- Understand the detailed figure requirements of the target journal
-
- Resolution (e.g., 300 dpi), file formats (e.g., TIFF, PNG, JPEG), size limits, and color mode (RGB or CMYK).
- Fonts, labels, units, and symbols.
- Check if the journal requires specific styles for graphs, charts, or images, such as font size, line thickness, or color schemes.
- Learn some basic data visualization knowledge
-
- Explore online resources, tutorials, and courses on data visualization to improve your skills. Platforms like YouTube offer valuable insights.
- Learn about color theory, layout design, and how to highlight key data points.
- Use professional image processing software
-
- Invest time in learning tools like Adobe Photoshop and Illustrator, or free alternatives like GIMP for creating and editing high-quality visuals.
- Ask peers for optimization suggestions
-
- Share your visuals with peers to get constructive feedback on clarity, design, and effectiveness. Ask if the visuals convey the intended message clearly and if any elements (e.g., colors, labels, or layout) could be improved.
- Pay attention to copyright issues
-
- Use images, icons, or graphics that you have created, have permission to use, or are licensed under Creative Commons or royalty-free terms. Always credit the original source if required.
- Avoid using copyrighted material without proper authorization, as this can lead to legal issues.

At MDPI Author Services, we specialize in helping researchers prepare their manuscripts for publication. Our Figure Editing Service provides publication-ready figures that clearly communicate your research to readers. Figure editing enhances your charts and graphs by revising the colors, shading, size, resolution, borders, font, and file type. This is all completed in one business day after payment. Click here for a free quote.
Subscribe to the Author Services Newsletter for tips, discounts, and updates.